

Rs 500 note the king of cash; share rose the highest in FY21
The share of all currency notes except Rs 500, Rs 200 and Rs 20 in the economy dipped in Covid-hit FY21 compared to the previous year

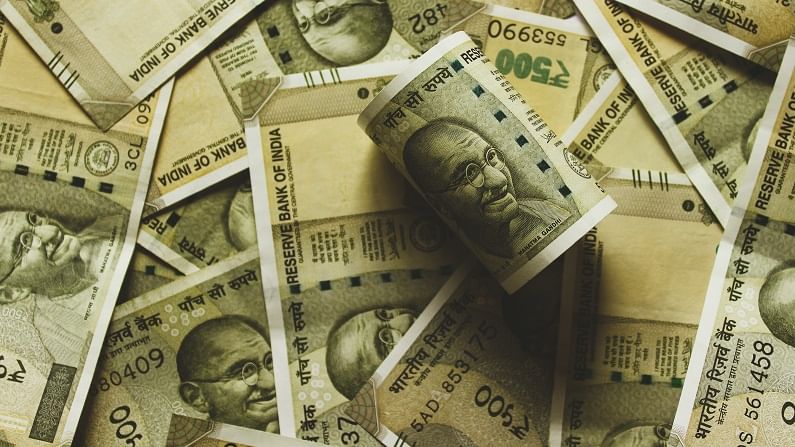
As the pandemic raised cash in circulation in the economy to record levels in the recent past, the Rs 500 currency note emerged as the king of the wallet registering a sharp rise in the share of notes in Covid-crippled FY21.
According to the data revealed by Reserve Bank of India, the number of Rs 500 in use rose from 25.4% in FY20 to 31.1% in FY21 – a rise of 5.7 percentage points. Compared to FY19, when its share was 19.8%, the jump was by a massive 11.3 percentage point.
Value terms
Value wise, too, the share of Rs 500 note rose from 51% in FY19 to 60.8% in FY20 and further to 68.4% in FY21, fixing its status as the darling of Indians. In FY19, Rs 500 notes comprised 51% of the value of all the cash.
No other currency note gained such fast circulation recently.
Gainers, losers
In its annual report for FY21, Reserve Bank of India has stated that the share of Rs 20, Rs 200 and Rs 500 notes rose in FY21.
The share of Rs 2, Rs 5, Rs 10, Rs 50, Rs 100 and Rs 2,000 notes contracted during the year compared to the previous year.
Rs 2k lose share
The share of Rs 2,000 notes, the highest denomination, went down by 0.6 percentage points – from 3% to 2.4% of all the notes in circulation. It had a share of 3% of all the currency notes in the country.
The smallest denomination suffered the highest fall in share, perhaps signifying the fast erosion of their purchasing power. The share of Rs 2 and 5 notes which was 10.4% in FY19 and 9.7% in FY20 further dipped to 9% in the last financial year.
Sharp drop
There was a sharp drop in the Rs 10 note too that tumbled from 28.7% in FY19 to 26.2% in FY20 and further to 23.6% in FY21.
Rs 50 notes dropped from 7.9% in FY19 to 7.4% and 7% in the next two years.
Even the share of Rs 100 notes went down. It dipped from 17.2%in FY20 to 15.3% in FY21. The share was 18.5% in FY19.
Crept up
The Rs 200 note, the most recent addition, crept up from 4.6% in FY20 to 4.7% in FY21. It had a share of 3.7% in FY19.
In terms of value, the highest denomination of Rs 2,000 notes comprise 17.3% of the total value of Rs 28,26,863 crore of all the currency in circulation.
Rise of cash
The total value of cash going around rose from Rs 21,10,892 crore in FY19 to 24,20,975 crore in FY20 – a rise of 14.69%.
Between FY20 and FY21 the value of the cash in circulation registered a rise of 16.76%.
Numbers of notes
The number of total currency notes in circulation also went up from 10,87,594 lakh in FY19 to 11,59,768 lakh in FY20 and further on to 12,43,671 lakh in FY21.
While the rise between FY19 and FY20 was 6.63% that between FY20 and FY21 was faster 7.23%.
Cash security
On an average, Indians are storing cash more than what they used to do in the past 10 years. Thanks to lockdowns that can prevent access to cash and apprehension of a sudden need for medical emergency, the circulation of cash in the economy has gone up to a level that is highest in the past two decades.
Though one of the stated goals on the Centre is to build a cashless society, the circulation of cash kept rising in the past two years.
14.6% of GDP
Currency as much as 14.6% of the GDP was in circulation in 2020-21, which was a significant jump from the 12.03% in the year before.
During the past decade cash in circulation as a share of GDP stood at 12.22% in 2011-12, 11.98% in 2012-13, 11.58% in 2013-14, 11.62% in 2014-15 and 12.08% in 2015-16 before diving to 8.26% in 2016-17 following the demonetisation on November 8, 2016.
However, it gradually climbed back to 10.7% in 2017-18, 11.31% in 2018-19 and 12.03% in 2019-20.
Back in June 2020, an article by economists of RBI observed that the pandemic triggered flow of money from savings instruments like mutual funds into currency holdings.
The use of cash rose even as digital payments and online transactions rose at a fast pace during the pandemic.
Past 50 years
On the other hand, the average growth rate of the currency in circulation (CiC) in India has remained within the 11-15% band in the past 50 years.
Between 1971 and 1980, it grew at 11.6%, between 1981 and 1990 CiC rose by 14.6% and between 1991 and 2000 by 15.2%. After rising for three decades, there was a dip in the rate of growth cash circulation in this century.
In the first decade (2001-10) the growth rate stood at 15.1%. The next decade (2011-2020) saw a marked deceleration when cash rose by 12.6%.