

An age-old secret to wealth creation
You may be holding onto cash, waiting for the market to correct but you do not know when that opportunity would come


Often investors sit on the side-line in a bid to time the market. We have tried to reason why an average investor might be better off investing through a Systematic Investment Plan (SIP). The SIP approach benefits from the power of compounding and rupee cost averaging.
The post Covid era has seen equity markets around the world scaling new highs, this has made some investors jittery on thoughts on market receding. It seems logical to sit on sidelines and invest once market correct significantly (Buy the dip), but is it that easy to execute?
To evaluate the fabled ‘Buy the dip’ strategy, we have compared it to the ‘humble SIP’ strategy and ran some simulation to see which strategy works out well. Before jumping into the analysis it is imperative to understand the assumptions that are central to these simulations:
1. SIP strategy: It is assumed you would be investing Rs.10,000 every month over the years
2. Buy the dip strategy:
a. Assume you are blessed with a superpower to perfectly predict the future- you exactly know when the market would clock its highs and lows
b. With you being able to predict the future, you would easily be able to execute the ‘Buy the dip’ strategy
c. A dip is defined as an absolute bottom between any 2 consecutive all-time highs. You accumulate Rs.10,000 every month and deploy the accumulated cash only at dips. Money is assumed to be invested on the day of the dip.
d. It is also assumed the un-invested cash doesn’t earn any income (for simplicity)
3. The money invested, will not be redeemed till the end of 2020.
4. For simulation of the performance of both strategies, total returns of the Nifty 500 Index are used for the period from 31st Dec 1998 to 31st Dec 2020. (Note – For simplicity, we have ignored the expense ratio and tracking error)
What is the ‘Buy the dip’ strategy?
Exhibit 1: Buy the dip strategy chart


Source- www.niftyindices.com, MOAMC research. Performance data from 31-Dec-1998 to 31-Dec-2020. The above graph is used to explain the concept and is for illustration purpose only and should not be used for development or implementation of an investment strategy. Past performance may or may not be sustained in future.
Exhibit 1 above is a graphical representation of the buy the dip strategy. For ease, we have considered a period between Dec 2007 and Mar 2014 (Global Financial Crisis), where it took a staggering 75 months for the Nifty 500 to regain its previous peak (as of 28th Dec ’07- 6,890). During this period a ‘dip’ (defined as absolute bottom between 2 highs) was formed on 27th Oct ’08 (2,604).
During Dec ’07 to Oct ’08, an investor is assumed to be accumulating cash for over 10 months and deploy it on the day of dip. Now that we fully understand, below we have plotted the strategy for the entire study period (i.e. 1998-2020).
Plotting the ‘Buy the dip’ strategy
Exhibit 2: Buy the dip
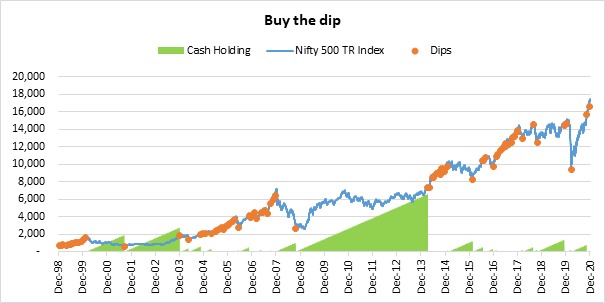
Source- www.niftyindices.com, MOAMC internal research. Performance data since 31-Dec-1998 to 31-Dec-2020. The above graph is used to explain the concept and is for illustration purpose only and should not be used for development or implementation of an investment strategy. Past performance may or may not be sustained in future
In exhibit 2 above, during the period Dec ’98 to Dec ’20, the index noted 81 dips (i.e. buying the dip opportunities).
An interesting observation is that majority of the dips are concentrated during bull run. It seems intuitive as the index scales new highs often during a bull run. This means that the money deployed during bull runs would be invested at higher lows, while there would be very few instances where an investor would be accumulating cash.
Of the total buying (i.e. dip) opportunities, there were only a handful of opportunities to generate significant gains. The Dot Com Bubble (2001), Global Financial Crisis (2008), and the recent Covid induced market crash (2020) presented such opportunities.
Historically it is observed that post dip of major stock market crisis, investor needs to sit on cash for considerable period of time. For example, from the dip of ‘Dot Com Bubble’, it took 28 months to find new ‘buy the dip’ opportunity, similarly it took 66 months from dip of Global Financial Crisis to find new ‘buy the dip’ opportunity. Realistically speaking it is impossible to know how sooner/later the market would reach a new high/low.
“The markets can remain irrational longer than you can remain solvent”
—John Maynard Keynes
Enough of insights, now for the moment of truth – which strategy do you think would have fared well
Exhibit 3: Results of Simulation of SIP and ‘Buy the Dip’ strategy


Source- www.niftyindices.com, MOAMC internal research. Performance data since 31-Dec-1998 to 31-Dec-2020. The above graph is used to explain the concept and is for illustration purpose only and should not be used for development or implementation of an investment strategy. Past performance may or may not be sustained in future.
As shown in the exhibit 3 above, the humble SIP strategy has outperformed the superpower-enabled ‘Buy the dip’ strategy by 5% (absolute returns). The 5% outperformance doesn’t sound astonishing but on second thought it was earned by merely blindly investing every month. What’s more interesting is – had you delayed (mistimed) cash deployment in the dips by just 1 month, the SIP strategy would have outperformed by ~11% (absolute returns). If you missed the dip by 2months then SIP strategy would have outperformed by ~16% (absolute returns). While our central assumption in the ‘Buy the Dip’ strategy rests on your superpower to predict future market ups and downs. We only wish if this superpower was a reality, until then let the age-old secret of wealth creation (SIP) work for you.
Why SIP works?
1. No need to fret over right time to enter the market – History has proven that, right time to enter and exit the market, is next to impossible. Yet, investors often tend to overestimate their ability to time the market and usually end up making bad decisions. ‘Time in the market’ is more important than ‘timing the market’.
2. Takes emotion out of investing – Humans are driven by 2 powerful emotions – Fear and Greed, which can act as an impediment in thinking straight. With SIP you can eliminate the urge to go all-in on high-risk investments in a rising market.
3. Stay invested longer – SIP helps you spread your risk by buying regularly irrespective of market levels, which helps to stay in the game longer.
Although SIP too has its fair share of criticisms. Firstly, buying more frequently adds to transaction costs, albeit the transaction costs are on the decline. Secondly in a rising market, you may forego some returns which you could have earned by taking the lump sum approach.
You may be holding onto cash, waiting for the market to correct but you do not know when that opportunity would come. As said by Peter Lynch “Far more money has been lost by investors trying to anticipate corrections, than lost in the corrections themselves”. Instead of trying to time the market, the ‘time in the market’ matters. So sit back, relax and let SIP do its magic.
Disclaimer
Source- Index values- www.niftyindices.com. Data as on end of 31-Dec-1998 to 31-Dec-2020. *Nifty 500 TRI used as a proxy for a passive fund tracking a broad-based index; Nifty 500 TR index performance is not adjusted for expense ratio and tracking error. This post has been inspired by Even God Couldn’t Beat Dollar-Cost Averaging – Of Dollars And Data.
The author is Vice President, Research (Passive Funds), Motilal Oswal Asset Management Company; views expressed are personal.