Don't miss: Elara Capital's 7 observations can protect you from any correction in the market
One interesting Index that Elara calculated is the Penny Stocks Index. It has been a strong precursor to gauge extreme market sentiment

Individual investors have been the driving force in the equity markets over the last one year, not only in India but across the globe. Brokerage Elara Capital in its latest note tried to capture the extent of investors participating in the Indian markets in the cash and F&O segment and compared it with the history. The objective of the study is to give a perspective on the extent of retail and high net worth investor crowding in the markets and find ways to capture a break of this momentum which could also indicate a reversal in market trend and shift in portfolio positioning.
“Most retail or HNI curves have scaled back closer to the historic highs but momentum still remains strong in them. Once the momentum starts fading, we could get indications of waning retail appetite,” Elara Capital said. Below are the seven observations which investors should focus on while investing in the stock market.
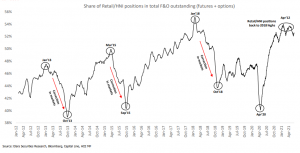
Retail/HNI market share in F&O positions – Scaled back closer to highs
The curve measures the proportion of the total F&O outstanding positions held by retail/HNI players. This curve reflects their total exposure in markets across index futures, stock futures, index options and stock options. From almost a decade low zone in April 2020, it has now scaled back to higher end of the zone. In past, a fall in this curve has been an indication of waning retail or HNI appetite in the market which was followed by a correction.

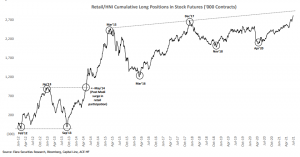
Retail/HNI cumulative long positions in stock futures – Reaching back to highs
The curve measures the cumulative long positions of retail/HNI players only in the stock futures segment. Retail players take the biggest leverage through stock futures hence a reflection of risk exposure taken by them. The curve is very close to scaling back to 2018 highs, which was also the high seen in Mar 2015.

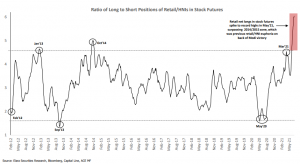
Ratio of long to short positions of retail/HNI in stock futures – Break to new high
This is an important curve as it measures the long exposure of retail/HNI in stock futures compared to their short exposure. By nature, retail positioning remains on net long side but this time they are lacking shorts indicating a big unhedged positioning. The curve has started spiking sharply since the last 2-months, breaking January 2013 and October 2014 highs.

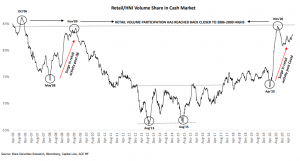
Retail/HNI volume share in cash markets – Participation back to 2006-2009 highs
Retail/HNI volume share in the cash market has reached back to 2006-2009 highs. Direct retail participation in markets was on a drop after the big market top of 2010. This started gradually increasing from 2015 after PM Narendra Modi victory. However, Elara saw a sharp spike in participation post-Covid as many retail players entered markets to make quick money since most businesses were closed due to lockdown. The curve shows a big portion of retail activity is already in the markets and any scope of a big expansion from here looks unlikely.

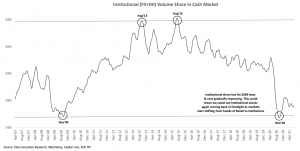
Institutional volume share in cash markets – Drop to 2009 lows
Institutional volume share (FII+DII) in cash markets has reached back to 2009-2010 lows. The brokerage said it has started seeing some improvement in the market share of institutions. If this curve starts recovering, it could be an indication that we could see institutional stocks again coming back in the limelight as markets start shifting from the hands of retail/HNIs to institutions. Investors should closely monitor this trend.

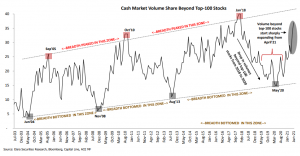
Volume share beyond top-100 stocks- Big spike in last 2 months
The curve measures the proportion of cash market volumes trading beyond the top-100 stocks. There is a very sharp spike in this curve since April 2021 on back of crowded retail activity. As of now the curve remains in strong momentum. Reversal in this curve will be an indication of markets moving back into top-100 stocks. As of now no signs or reversal are visible here.

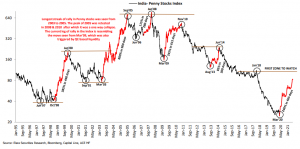
India Penny Stocks index- About to reach back to 2018 zone
One interesting Index that Elara calculated is the Penny Stocks Index. It has been a strong precursor to gauge extreme market sentiment. Interestingly the index also peaks out a few months before the actual market correction. During the previous QE rally from 2009 to 2010, it rallied by 245% in 615 days. In the current leg, it has rallied 240% in 465 days. Over the last 15 years, the index has always peaked out at the previous high zone (which in current case is at 2018 level). Only one big rally which continued in this index was from 2003 to 2005 on the back of hope of an economic turnaround and period when we saw big migration of liquidity from developed markets to emerging markets. In all other cases, this index has peaked at the previous high zone where it is about to reach. Hence it will be crucial to monitor. This index will also help us to understand if the risk appetite of retail players is reversing.