

Does Profit Really Depend on Revenue?
If we look at companies that grew at a pace slower than that of GDP, their profit increased by 2.5% for every 1% increase in revenues


Whenever we discuss a company, we tend to focus exclusively on its earnings. We scrutinize how the company is earning revenue, or its top-line, and how they are translating into profits, or the bottom-line.
The natural assumption is that there is a natural link between the two. If a company’s revenues are growing, then profits are bound to grow. But is that really the case?
To answer this question, we looked at the relation between revenue growth and profit growth of 4,185 companies for the period between FY14 and FY23. This includes both listed and unlisted companies, while the data has been sourced from Ace Equity. We calculated the CAGR of revenues and profit for all these companies between the said period.
Here are some key observations:
• If a revenue of a company increased by 1%, then it’s profit jumped up by 1.07%.
• However, if we look at companies that grew at a pace slower than that of GDP, their profit increased by 2.5% for every 1% increase in revenues
• But in case of companies which grew at a rate quicker than that of GDP, the profit growth did not depend on its revenue growth.
We examine the patterns and relations of revenue and profit growth and how companies at the extreme ends of the spectrum performed. We also attempted to assess their profitability by placing the companies on either side of GDP.
Revenue Growth (CAGR)
We calculated the revenue growth (CAGR) of all the companies for the period between FY14 and FY23. Then, we grouped them on the basis of their growth rate (frequency distribution) and plotted the same.
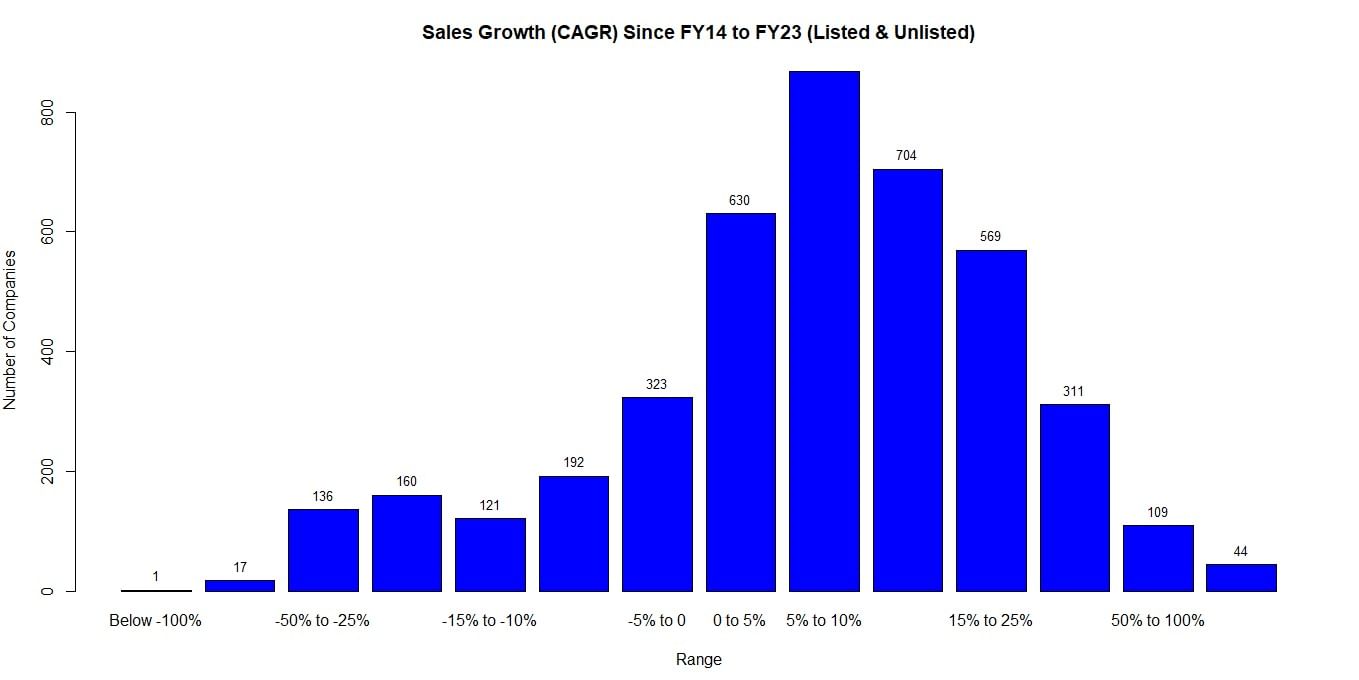

Source: Money9 Research, Ace Equity
Here, we see that the maximum number of companies have grown at rates between 5% and 10%.
Profit Growth (CAGR)
Just like revenue growth, we assessed the profit growth of these companies for the period between FY14 and FY23.
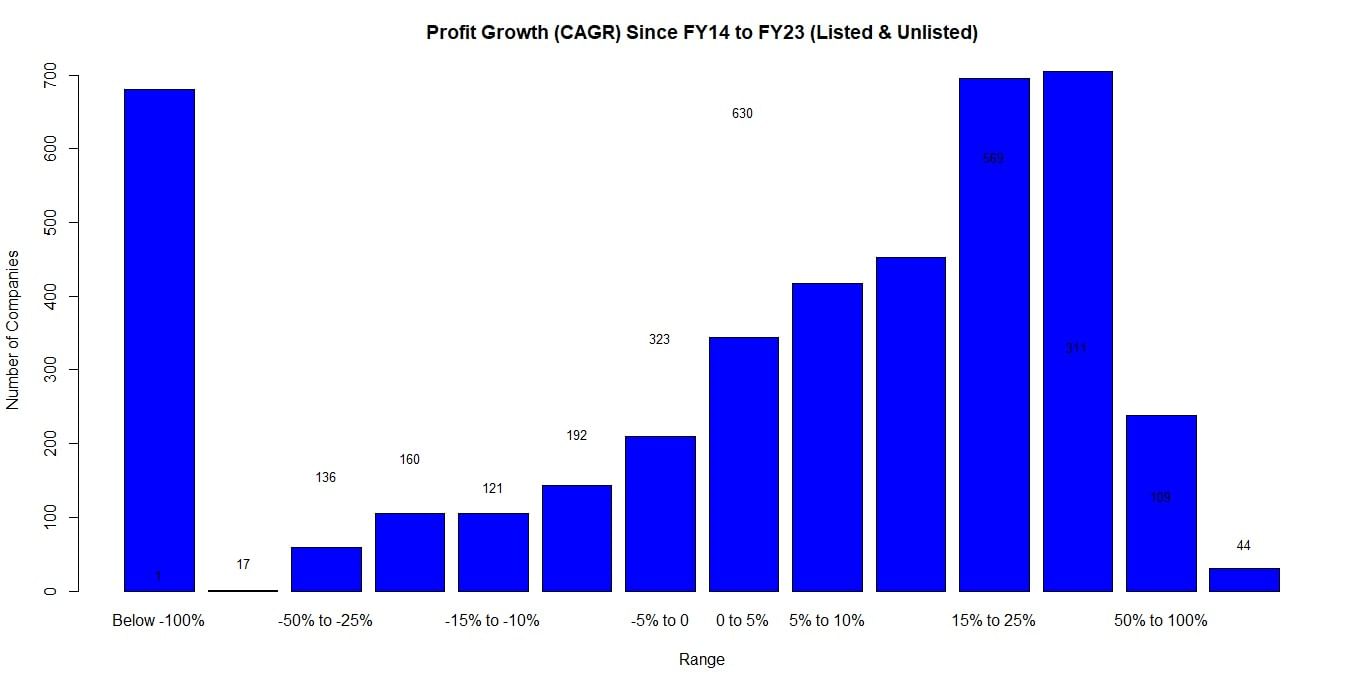

Source: Money9 Research, Ace Equity
We notice an uneven distribution, with 1,669 companies growing at a rate higher than 15%, while 1,303 companies witnessed a decline in profit.
Profit and sales growth relation
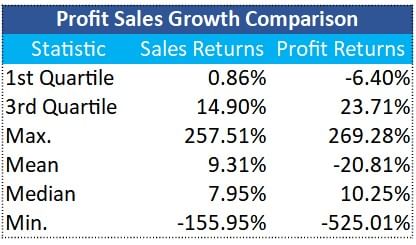

Here, we compared the distribution of profit and revenue growth. It can be noticed that, while on an average, profit of companies have declined, it is primarily due to a few companies witnessing a significant decline in their profits. If we look at median value, it stands at 10.25%. However, noticeably, there is more variability in profit growth of companies.
It was noticed that growth of profit is actually dependent on revenue growth. A 1% increase in revenues lead to 1.07% increase in profits.(Refer to appendix 1 for details about regression)
Companies with extreme performance (Outliers)
Next, we looked at companies whose revenue either grew or declined at a rapid, pronounced rate. These have been termed as outliers.
(Refer to appendix 2 to for Outliers formula on the basis of IQR)
First, we looked at companies whose revenue increased at a quick pace. These have been termed as outliers at upper end. There were 188 companies in this group.
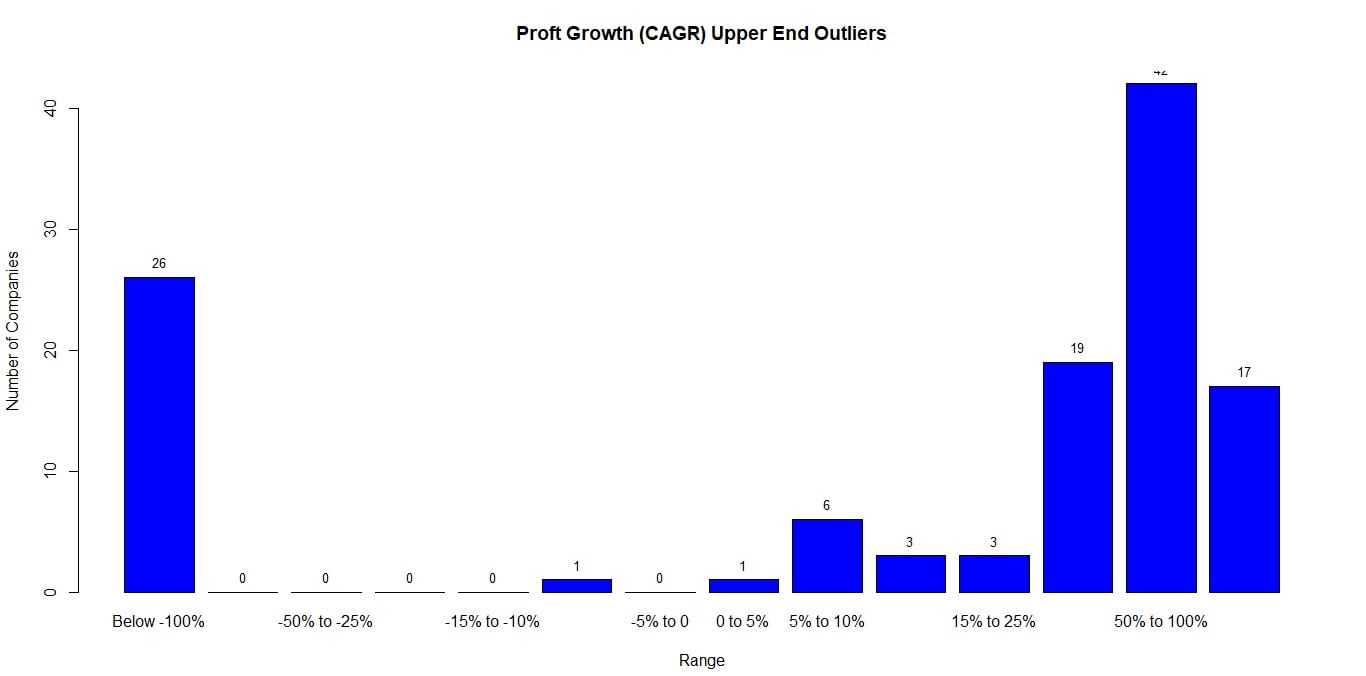

Source: Money9 Research, Ace Equity
Most of the companies at upper end witnessed massive profit growth.
Next, we looked at companies whose revenue declined at a considerable rate, which were termed lower-end outliers. There were 47 companies in this group.
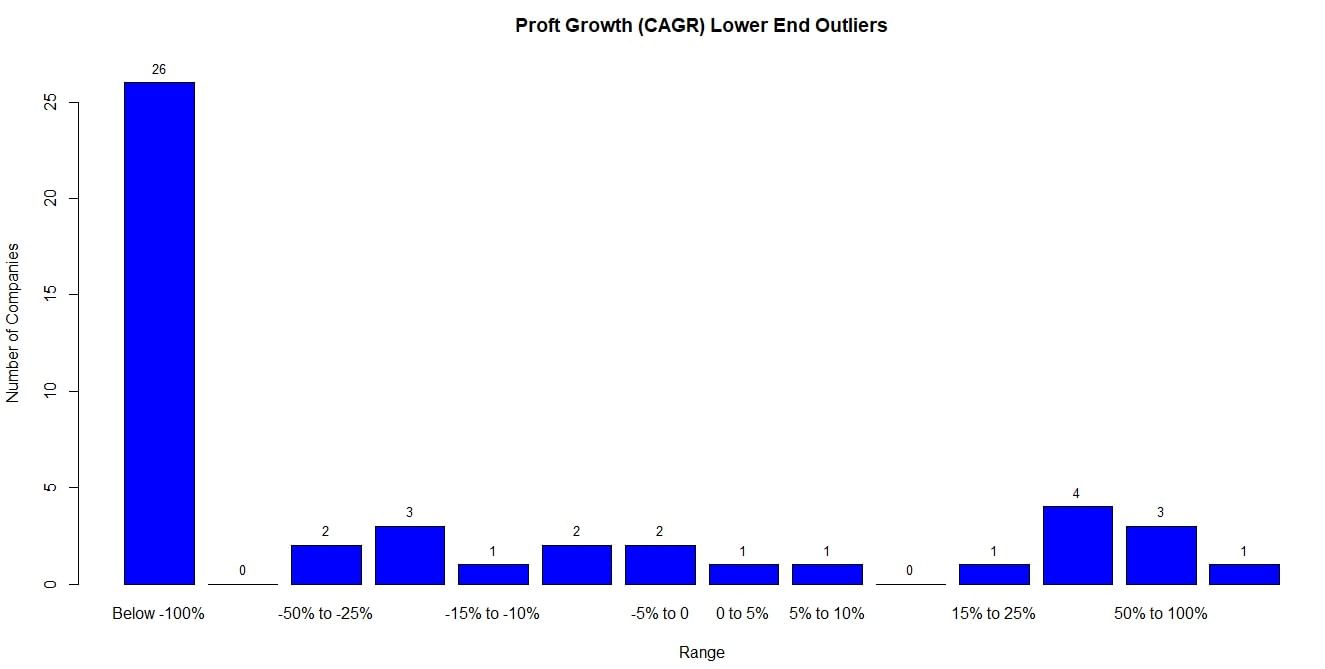

Source: Money9 Research, Ace Equity
For 26 out of 47 companies, profits declined at rate of more than 100%.
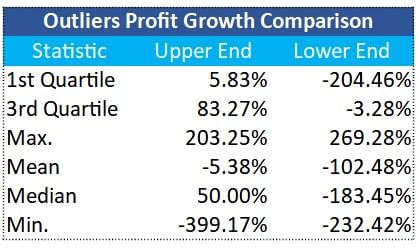

Here, we can see that there is more variability in profit growth when it comes to lower end outliers/companies. In order to assess whether profitability in these two groups behaved differently, we conducted statistical tests and the confirmed that indeed, behavior of profitability growth in upper and lower end companies was different.
(Refer to appendix 3 for details about statistical tests)
Comparison with GDP Growth
Between FY14 and FY23 the period, nominal GDP grew at 9% CAGR. (We took nominal GDP instead of real GDP, since growth in sales for all companies is also nominal).
So, we divided all the companies in 2 group. In group one, we had all the companies whose revenues grew at pace slower than that of GDP (GDP Laggards). In the second group, we had all the companies whose revenues grew at a pace quicker than GDP (GDP takeovers)
First, we looked at GDP Laggards and tried to assess their profitability. There were 2,281 companies in this group.
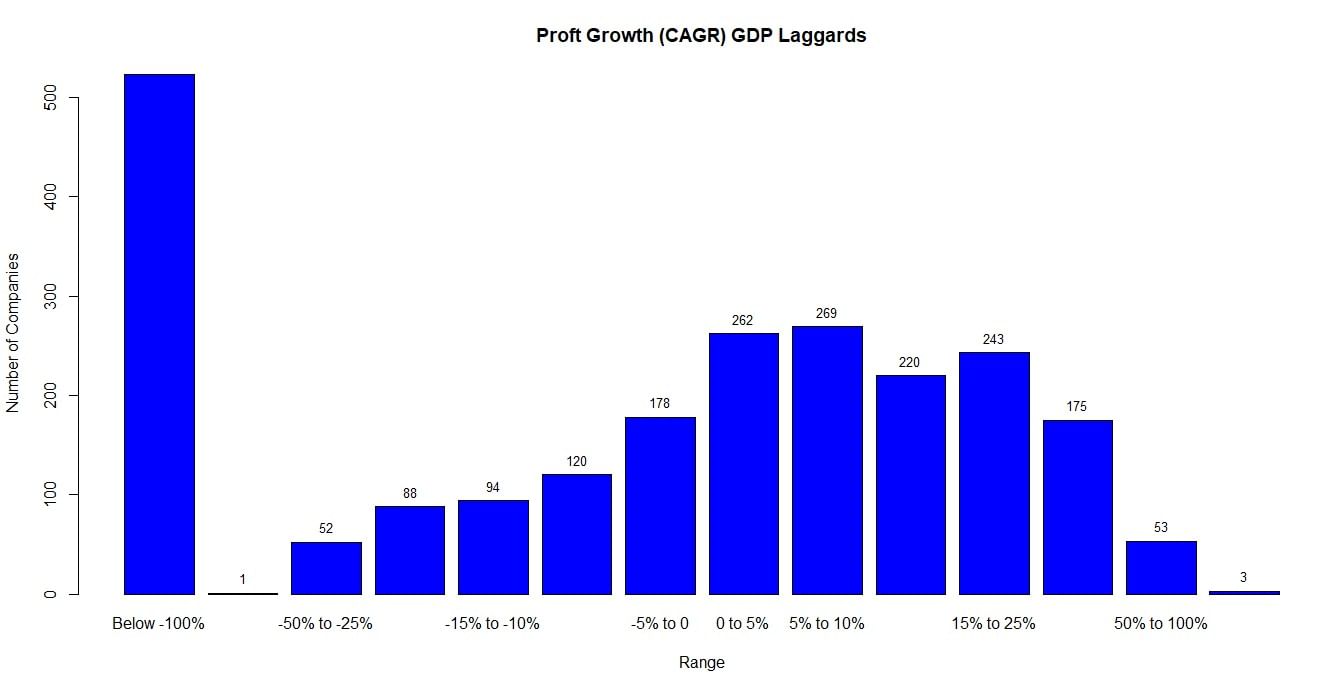

Source: Money9 Research, Ace Equity
Here, we can see that for more than 500 companies, profits declined at annual rate of more than 100%.
We also noticed that in this case, profit growth is more sensitive to revenue growth. For every 1% change in revenue growth, profit growth changed by 2.6%.
(Refer to Appendix 4 for details about regression)
Next we looked at GDP takeovers (companies whose revenues grew at pace quicker than GDP). There were 1,904 companies in this group.
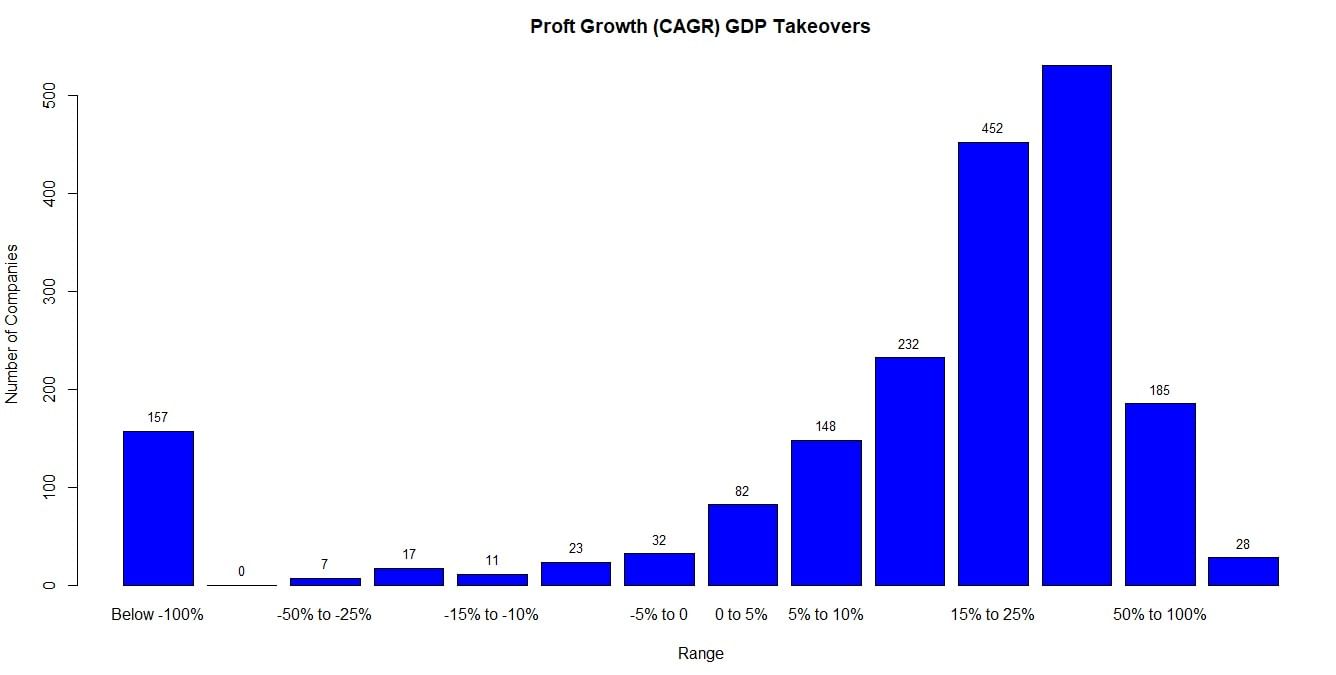

Source: Money9 Research, Ace Equity
Here, we can see that most of the companies have had a positive profit growth. Interestingly, revenue growth doesn’t impact profit growth significantly.
(Refer to Appendix 5 for details about regression)
Next, we compared the behavior of profitability in both these groups.
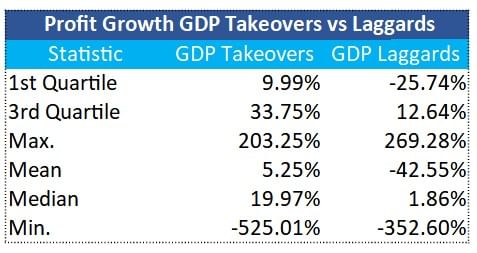

We can see that there is more variability in GDP laggards. Profits of 75% companies in the GDP takeover group increased at more than 9%. Despite the profit growth in this group, it remained independent of revenue growth.
Finally, we used statistical tests to confirm that behavior of profitability in both these groups is differs from each other.
(Refer to appendix 6 for details about statistical tests)
Hence, we can conclude that overall, the profit growth of a company is impacted by revenue growth. But this is more likely in case of companies whose revenues grew at a pace slower than that of GDP and not in the case of companies whose revenue growth outpaced GDP.
Appendices
1) We regressed profit growth of all companies on their revenue growth. Regression co-efficient of revenue growth is 1.07 and that co-efficient is significant even at 0.1% level of significance. However, R squared is just 7%.
2) “Upper End Outliers = 3rd quartile + 3*IQR”, “Lower End Outliers = 1st quartile – 3*IQR”
IQR: Inter quartile range
3) T-Test and Wilcoxon Test showed that profitability growth of lower end outliers and upper end outliers companies behave differently. These test check whether both data sets belong to same population or different ones. T-Test is based on assumption of normality, but Wilxocon test is used for non-normal distribution where median is used for test. From frequency distribution chart it is clear that profitability growth in both cases showed non-normal distribution hence Wilcoxon test is also used.
4) In GDP laggards data set, we regressed profit growth on revenue growth. Co-efficient of revenue growth is 2.59 and that co-efficient is significant even at 0.1% level of significance. However, R squared is just 12%
5) In GDP takeovers data set, we regressed profit growth on revenue growth. Regression co-efficient of revenue growth is insignificant as P-value was 0.36. Also, correlation between profit growth and revenue growth in GDP Takover group was 0.02
6) T-Test and Wilcoxon test showed that profitability in both GDP takeovers and GDP laggards behaved differently from each each other. These test check whether both data sets belong to same population or different ones. T-Test is based on assumption of normality, but Wilxocon test is used for non-normal distribution where median is used for test. From frequency distribution chart it is clear that profitability growth in both cases showed non-normal distribution hence Wilcoxon test is also used.